
Instagram has changed, evolved and expanded a lot over the past ten years, along with its user base, commercial features, algorithmic structure, and technological prowess. As you develop your Instagram marketing strategy for 2023, it’s crucial to be up to date with everything Instagram.
We’ve gathered all the most significant Instagram statistics for this year so that you can work with the right data and insights to make more informed choices about where – and how – Instagram fits in your 2023 marketing plans.
Basic Instagram Statistics
Instagram Turned 12 in October 2022

Although often still thought of as a ‘newer’ social network, Instagram actually turned 12 in 2022. Which means if it is still not a part of your social media marketing strategy the chances are that you can now officially say that your plans are more than a little behind the times.
Instagram is the 7th Most Often Visited Website Globally
With 2.9 billion monthly visits, Instagram is one of the top 10 most-visited websites worldwide, coming in at #7, according to Semrush’s analysis of all internet traffic. That is a huge number of eyeballs potentially ready to view your content.
Importantly, although most users access their Instagram accounts through their mobile devices, this statistic serves as a useful reminder that users may also access your posts on their PCS, laptops and iPads, so make sure your images display beautifully at all sizes.
Instagram is the 9th Most Often Googled Search Term
Entering “instagram.com” into your browser is the not simplest way to get there from a browser. Google will take you there if you just Google it. Which apparently lots of people do.
Facebook, YouTube, and “weather” all outperformed Instagram in the search term stakes, but given that Instagram is largely accessed through the app, this is still an excellent search performance metric to be aware of and further evidence that your audience may be accessing your content through a browser, whether on a computer or a mobile device.
Another note. Even more searches are prefaced by a brand name – ie Company X Instagram – indicating that people expect the businesses they are interested in interacting with to be there, making that just another reason to make sure that you are.
Instagram is #4 in Social App Platform Usage
In terms of daily active users across the globe, only Facebook, Youtube, and WhatsApp surpass Instagram, yet Instagram has an astonishing 1.5 billion users.
That is a huge number of people. Instagram might be a better choice if you’re looking for the maximum audience reach for your content given that it currently outperforms TikTok, Twitter, Pinterest, and Snapchat.
Instagram User Statistics
Instagram Now Boasts 1.22 Active Billion Users a Month
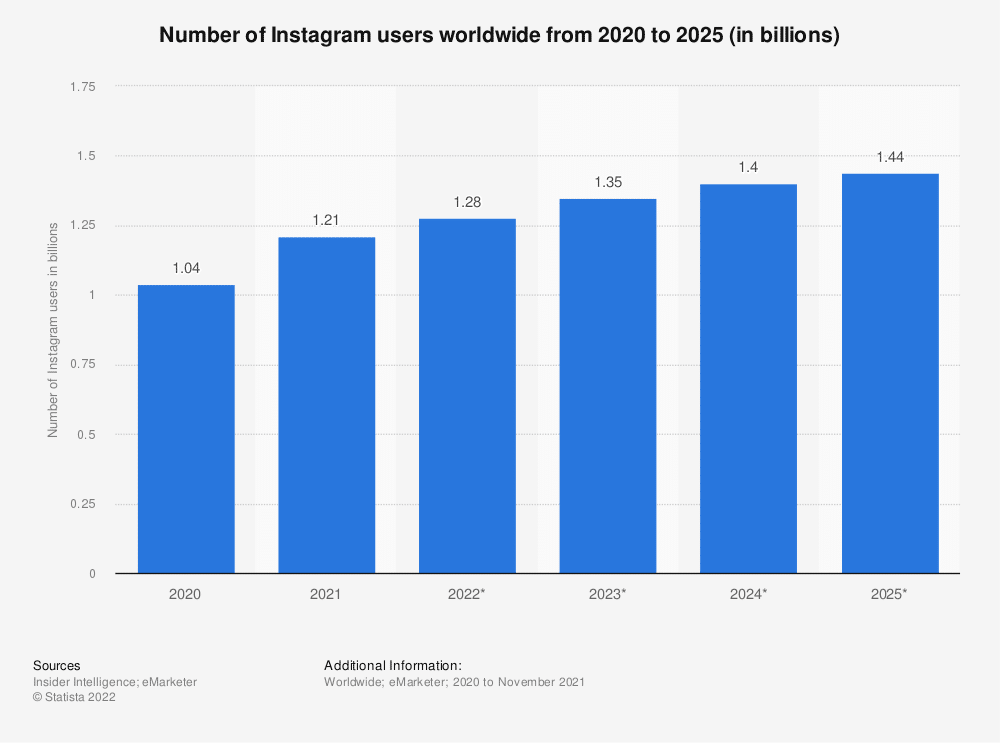
There are more than 2 billion registered Instagram users, but the fact that 1.22 billion of those are also considered active is rather impressive. It’s not the most active of the social networks – Facebook and YouTube can both claim more active monthly users – but those two behemoths aside, it’s a very lively place ‘to be’.
Instagram's Audience Still Skews on the Younger Side
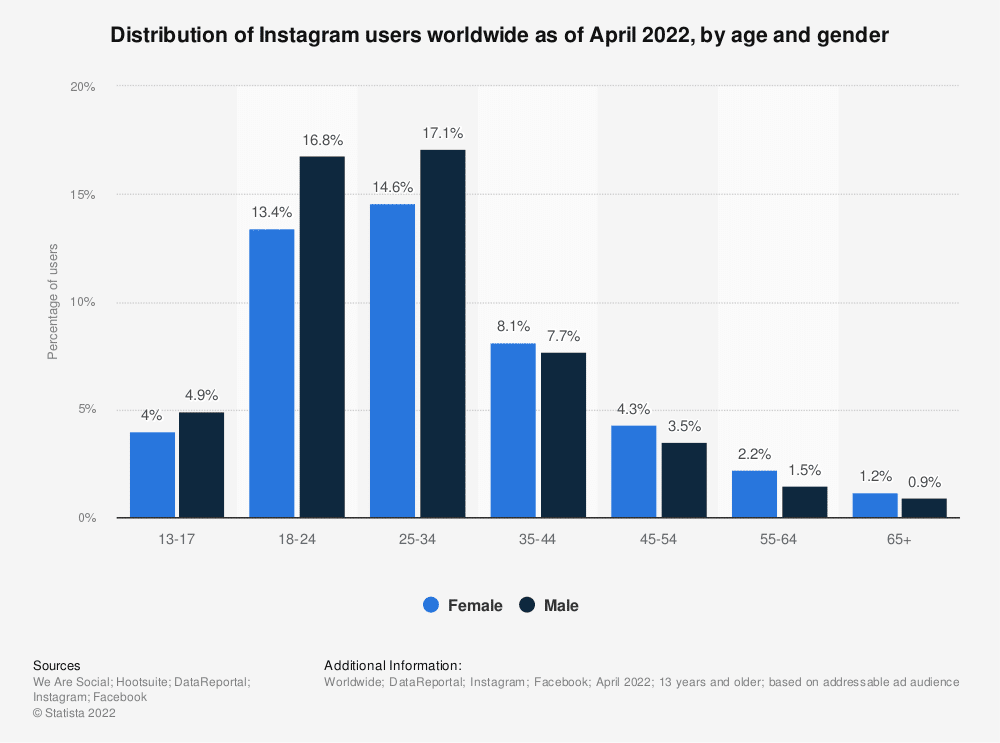
Unlike those two previously mentioned ‘competitors’ – Facebook and YouTube – which boast demographically balanced audiences – Instagram still skews relatively young, with more than 60% of its audience falling into the 18-34 age group.
Among Gen Z – considered those aged 16-24 in 2022 – it is the most popular social network choice, above TikTok or Snap, and certainly a place they are more likely to head than Facebook, which has somewhat fallen out of favour with that demographic.
One slightly unexpected demographic change that may be useful for some brands: an increasing number of Gen X males are now actively using Instagram. Males between the ages of 55 and 64 increased their use of Instagram by 63.6% last year. So, certainly, it is a place where kids convene, but don’t underestimate the fact that there are also members of other generations actively represented too.
Instagram (Is Probably) Fairly Gender Neutral
Official gender demographics Instagram statistics for 2022 are actually quite hard to come by. However, we may infer from Facebook’s reporting tools that 50.8% of Instagram’s readership is female and 49.2% is male. Relying on gender demographics only for Instagram’s core audience – Gen Z and Millennials – is not always the best idea though, as these are audiences known to actively avoid answering such questions.
The Largest Concentration of Instagram Users is in India
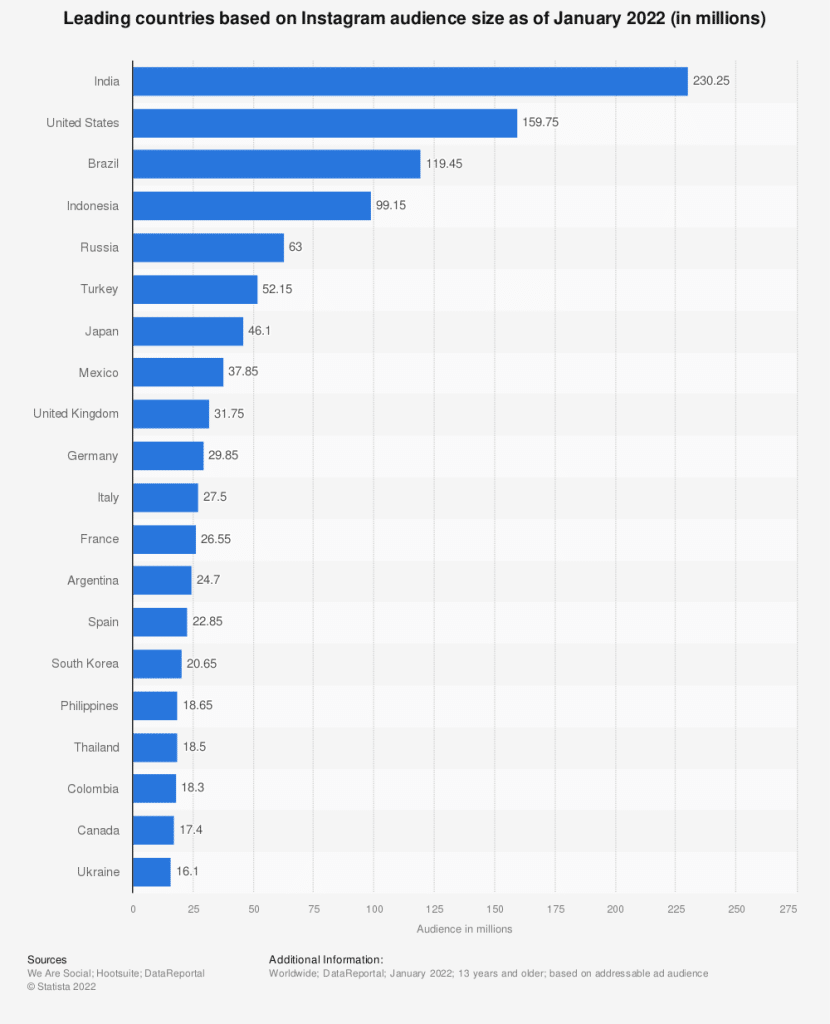
With 230 million users checking in from India, this serves as a terrific reminder that Instagram provides access to a global audience. They are followed in terms of the largest number of active users by the U.S. at 159 million, then Brazil, which has 114 million users, followed by Indonesia and Russia.
Instagram Usage Statistics
59% of US Instagram Users Log In At Least Once a Day
More than half of those with an Instagram account in the US log in at least once a day, and 38% of those people come back several times within a 24 hour period. In terms of active audience engagement those are pretty impressive figures.
Adult Instagram Users Spend at Least 30 Minutes on the Platform at a Time

Instagram users are not only regulars, but they spend an increasing amount of time on the platform when they do log in. According to the most recent time of usage statistics for the major social media platforms, compared to Facebook and Snapchat, Instagram had the highest percentage increase in user time last year. Adult Instagram users’ daily time increased by 13.8%, reaching about 30 minutes.
This time seems to be split fairly equally between the different forms of Instagram content too – posts, Stories and live videos – which is a good case for ensuring that you offer your brand’s Instagram content in all of those forms.
Instagram Story Stats
Speaking of the Instagram Story platform, here are some interesting Instagram statistics that relate specifically to that ‘side’ of the platform:
Increasingly, Instagram Story Views Lead to Purchases
58% of Instagram users say that after seeing a brand in a Story, they are more interested in it. Additionally, 50% of Instagram users claim to have visited a website to make a purchase after seeing a product or service in a story. Perhaps this is why tools such as free IG story makers, which help brands to create captivating and high-quality stories, have grown increasingly popular.
On Average, Brand Stories Can Boast an 86% Completion Rate
It’s easy to skip past an Instagram Story in your feed, but when it comes to brand stories it seems that most people don’t. On average branded stories have an 86% completion rate, with sports stories boasting the best numbers at 90%, and fashion and entertainment close behind at 89%.
Instagram Stories Now Account for a Quarter of Instagram's Ad Revenues
Even though they might not have the same reach as posts, Stories advertising is expected to generate close to $16 billion in worldwide net ad revenues in 2022.
More Instagram Statistics Businesses Need to Know

90% of Active Instagram Users Knowingly Follow at Least One Business Account.
Some companies are still unsure about whether or not business accounts really belong on Instagram. However, Instagram is a place to “build your network and enhance your connection with existing and future customers,” as the platform itself puts it. Instagram frequently releases new features for businesses, such as Instagram Live and an increasingly efficient and effective shopping functionality.
According to Instagram, the average business account that remains active – considered to be making at least one post a week – can expect to grow their audience by at least 1.69% per month.
1 in 2 Instagram Users Have Used It to Discover New Brands
Instagram is a fantastic tool for discovery: 50% of users use it to find new businesses, goods, or services. Furthermore, two out of three users claim that the network promotes positive connections with the brands they already know.
More Than Half Of Instagram's Users Like Polls and Questions
57% of Instagram users say they enjoy seeing polls and quizzes from brands on the platform, and more than 50% say they interact with them in some way.
Instagram users prefer quizzes and polls from brands compared to other social platforms, and you can easily incorporate them into standard posts or Stories, so don’t be shy—ask your customers what they want! They’ll feel heard, and it’ll give you more confidence in the choices you’re making for your company. Win-win.
44% of Active Instagram Users Shop There On a Weekly Basis
Instagram’s shopping feature was only released a few years ago, but it has already revolutionized the e-commerce industry. A survey conducted by Instagram for Business found that 44% of users use the platform on a weekly basis to shop using tools like the Shop tag and shopping tags.
Instagram Now Generates More Ad Revenue for Meta Than Facebook
Instagram’s shopping feature was only released a few years ago, but it has already revolutionized the e-commerce industry. A survey conducted by Instagram for Business found that 44% of users use the platform on a weekly basis to shop using tools like the Shop tag and shopping tags.
Instagram Content Statistics
There are an increasing number of ways to share content on Instagram, which can seem like a mixed blessing to many brands, especially if they are just beginning to implement an Instagram marketing strategy. The following Instagram statistics should be helpful in helping you determine the best content production priorities for your brand in 2023:
Hashtags #StillMatter
Posts containing at least one hashtag saw a 12.6% increase in engagement compared to posts without any. Additionally, posts with locations in the tags get 79% higher interaction. On average the best performing posts make use of 10.7 hashtags.
Consider Making More Carousel Posts
In terms of engagement per Instagram post type, The engagement rate across all post types is 0.83% on average. But it’s carousel posts that seem to perform best. Carousel posts have an engagement rate of 1.08%, it’s 0.81% for photos, and 0.61% for videos.
Add Some Noise to Your Stories
80% of the time, stories featuring voice overs or music result in longer view times and higher levels of engagement than those that are silent.
And Some People to Your Posts
Compared to photos without faces, photos with faces perform about 40% better on Instagram.
Don't Just Post Content on the Weekends
Yes, Instgrammers are young and busy, but that does not stop them spending time there on weekdays. On weekdays, Instagram users are more active, with Wednesday and Thursday displaying the highest levels of activity and highest levels of engagement in terms of time.
The Most Successful Instagram Business Accounts Post Often
The most successful business accounts on Instagram publish an average of 1.6 times per day, according to the platform itself.
To further break that down, 62.7% of all main feed posts for an average Instagram Business account are images, followed by 16.3% of videos and 21% of photo carousels.
Of course, every brand is unique, but it’s interesting to observe how the competition (on average!) varies the kinds of content it produces. If you’ve consistently followed a photos-only game plan, perhaps it’s time to explore branching out.
Instagram’s Most Popular Posts of 2022
To end on an interesting note, this Statistica chart breaks down the most popular posts of 2022 on Instagram so far this year, and it’s a very mixed bag.
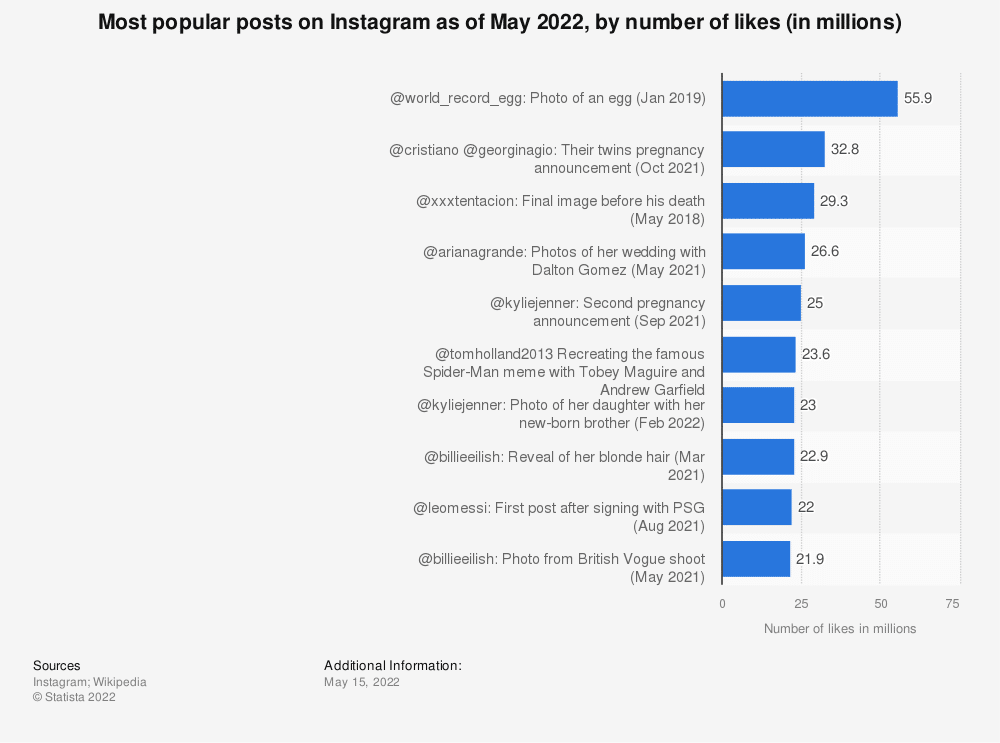
Billie’ blonde hair, an egg (!!) and all the Spidermen were all hugely popular, a sign that an image of almost anything may go viral on Instagram at any time!